Practical
Use Of Oscilloscopes
1. Use Of
The Oscilloscope When Troubleshooting Does Not Trigger A Fault:
1. When troubleshooting does not trigger a fault, it is often
necessary to detect whether the 32.768KHZ crystal oscillator of the South
Bridge and Ehas started to oscillate. The normal waveform is as follows:

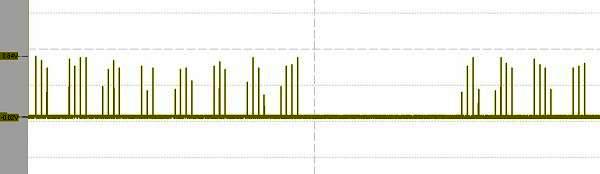
2. When maintenance does not trigger a fault, whether the EC can successfully read the contents of the BIOS and enter the working state is an important test point for us. The normal waveform is as follows:
BIOS first pin CS#.


The sixth pin of BIOS is S_CLK.

2. Use Of
Oscilloscope To Repair Switching Power Supply
1. When inspecting switching power supply, it is necessary to
determine whether the power chip is protective and has no output or is not
working and has no output due to its own reasons. The most effective method is
to measure whether the DH (Gate of the Upper Mosfet) has an instantaneous
voltage. The wave output is VIN+5V. The following figure shows the waveform
captured during normal operation.

The G pole of the lower Mosfet is DL, and the waveform power is
5V. The picture below shows the waveform captured instantly when there is
no protective output.

Note: Sometimes during actual maintenance, it is necessary to
remove the upper and lower MOS Mosfets and measure the waveform of the G pole
of the upper Mosfet. If this is the case, a 5V square wave output should be
measured instantly.
2. Connect it. When it is detected that the upper Mosfet G
voltage is not enough, you need to detect the BOOT bootstrap terminal of the
power chip. The waveform is a square wave from DH to VIN+5V.

3. Connect it. When DH can reach a normal waveform, you need to measure
the waveform of the LX node (front end of the coil power supply). Normally it
is a square wave = VIN.

4. Connect it. When LX can measure the
normal waveform, you need to measure the back end of the coil power supply,
which is the soft start process of the output voltage. Observe whether the
voltage is good during the startup process from 0V to the target value, and
whether there is under voltage. Or in the case of overvoltage protection, the
normal waveform is as follows:
VCCDDR soft start.

VCORE soft start.

Abnormal VCORE soft-start waveform.

5. Soft start comparison chart of 3 and 5V dual-channel capture system.

3. How To
Use The Oscilloscope During The Hard Start Process After Powering On
1. After powering on, check whether the main power supply of
the motherboard is normal. You can measure the front-end LX of their coil power
supply. Normally there will be a square wave.
VCCDDR node waveform.

VCORE node waveform.

You can also measure VOUT, which is the back end of the coil inductor or
the positive pole of the filter capacitor, to see if there is a smooth DC
current, as shown below:

Note: No matter what kind of power supply a good power supply is, such as memory, CPU, common point or 3V, 5V, when measuring its DC, a good power supply must be a smooth DC without burrs. If the measured DC is not ideal enough, For example, if there is too much clutter, consider whether the filtering is good. Such a power supply will cause various unstable failures compared to notebooks.
If sometimes it can be turned on normally and light up, sometimes it cannot, or if a blue screen of death occurs and the power is lost, etc., if the above unstable fault occurs, you need to use an oscilloscope to check whether the power supply is good and smooth, but a Multimeter cannot do this.
2. When the power supply to the motherboard is normal, you need to check
whether the clock circuit on the motherboard is working normally according to
the timing. In the past ICH era, you could measure the 330 resistor next to the
clock chip. Normally, you can measure many different clock frequencies. It is a
sine wave. The picture below shows the 100M clock of the Northbridge.

In the I-series era, the clock chip was
generally integrated into the PCH, so you can generally test whether the 25M
clock next to the south bridge is oscillating to determine whether the
motherboard clock is normal. The figure below is the south bridge 25 waveform.

Of course, measuring 25M oscillation does
not mean that the clock module inside the Southbridge must be normal and can
output the various sets of clocks required by the motherboard. Therefore, you
can test the clock pins of EC or network cards and other equipment to make a
judgment. The picture below shows the 33M of EC. Clock frequency.

3. When the clock circuit is working
normally and the next sequence is pressed, we can judge whether the motherboard
reset is normal by testing the 22-pin PLTRST# of the WLAN for a high level of
3.3V. The following figure is the soft-start waveform of PLTRST# .

CPURST#
4. After PLTRST# is raised, according to the timing, the last signal to be measured during maintenance is CPUURST#, which traditionally marks the end of the timing and the completion of the hard start. (Some I series machines are VGA_RST#) The picture below is the CPUURST# soft start waveform.

Important Points:
When CPUURST# is raised, the CPU begins to initialize, and then performs the soft-start process, that is, the CPU begins to address. To put it more simply, the CPU begins to grab the BIOS and call the POST power-on self-test. The program starts the POST self-test.
We must know that the CPU and BIOS are not directly connected by bus. From the architecture diagram we studied before, we know that it is a very difficult road for the CPU to find the BIOS, because the CPU needs to pass through the North Bridge, South Bridge, and even EC on the way to the BIOS. If any of the devices in the middle is working abnormally or there is a problem with the bus, the CPU will fail to find the BIOS.
4.
Application Of The Oscilloscope During The Soft Start Process:
ADS#
1. After knowing the principle, we can use the ADS# address
strobe signal (only available in the ICH era) during actual maintenance. When
the waveform in the figure below is captured, it means that the CPU has begun
to establish communication with the North Bridge. Generally, it can be confirmed
that the CPU starts working and the addressing instructions are sent to the
North Bridge.

PCI_FRAME#
2. Then, during actual maintenance, PCI_FRAME# can be
measured. If the following waveform appears, it can be considered that the
north and south bridges have begun to establish communication, and the north
bridge transmits the addressing instructions received from the CPU to the south
bridge. (PCH6 cancels the PCI bus).

LPC_BUS
3. Next, in actual maintenance, you can test the LPC bus
LAD0---LAD3 or LFRAME#. These five lines must be able to catch the pulse
waveform. If so, it can be considered that the south bridge and EC have begun
to establish communication. , Nanqiao passes the addressing instructions
through EC and captures the BIOS. Of course, this bus architecture
connection method is common in the ICH era. The BIOS is hung under the EC, and
the BIOS participates in the triggering.

SPI_BUS
4. Next, during actual maintenance, the SPI bus of the main
BIOS can be measured. Normally, several pulse waveforms can be measured. It can
be considered that the CPU has successfully captured the POST code of the BIOS,
and the soft start can be considered completed.
BIOS CS# chip select waveform.

SO waveform of BIOS pin 2.

5. Application
Of Oscilloscope In The Self-Test Process:
1. The next step is the self-test process. The CPU starts to
perform POST power-on self-test. First, it checks the integrity of itself and
the chipset. When both are good, the next step is to check PCI-E
first . Is the bus in good condition? Because the speed and frequency
here are very fast, generally the oscilloscope cannot capture the PCI-E
waveform. Therefore, in actual maintenance, it is generally judged by
measuring its impedance to ground with a multimeter. As long as there is no
open circuit or short circuit, it is generally considered OK.
SPD
2. The next step is to self-test the memory. Southbridge uses
SMB_BUS to read the SPD information of the memory, such as manufacturer, frequency,
capacity, etc. Therefore, in actual maintenance, we can test SMB_BUS to
determine whether Southbridge has started reading the memory. Normally
there will be a waveform as shown below.

ODT
3. The next step is the data transmission between the memory
and the memory controller, but before the data transmission, the memory
controller first verifies the memory through the ODT pin, and only starts
transmitting data after the verification is successful. By measuring it
during actual maintenance, it can be considered that the memory controller
starts to verify the memory. Normally there will be the following waveform.

4. Immediately afterwards, the memory
controller starts data transmission with the memory. We usually choose the
test point on each resistor on the memory, and also note the AD line. Normally,
pulses must be measured on multiple resistors to be considered as passing the
memory. As shown in the picture below, it can be considered that POST
successfully self-tested the memory.

After connecting, in addition to measuring
the AD line of the memory, if it is a third-generation memory, the RST# of the
memory can generally be measured and the memory can be judged. As shown
below, after passing through the memory, such a pull-down waveform will be
measured.

5. After passing the memory, we reach the
graphics card. We can test whether the AD line between the graphics card and
the graphics memory has the following waveform. If so, it is considered that
the basic working conditions of the graphics card have been met, and data
transmission with the graphics memory can be started.
EDID
6. Following EDID, it is also a means for the graphics card
to capture screen information parameters through the system management bus. It
is similar to Southbridge capturing memory. The graphics card thus obtains some
basic parameters of the screen, such as maximum resolution, manufacturer, etc.
In actual maintenance, we usually test the EDID to see if
there is a correct waveform. If so, it can be considered that the graphics card
has started working. Of course, its working conditions are basically OK.

7. After the graphics card obtains the
screen information through EDID, it starts to send out the screen power on
signal LCD_EN and the backlight on signal BLON to light up the screen (Note:
According to the machine design, some machines send out LCD_EN first and then
EDID).
LVDS
8. After the screen receives power from the screen, the
circuit on the screen can start to work. Finally, the graphics card transmits
the image information to the screen through the screen cable through the LVDS
differential signal to finally form an image.

Note: LVDS is generally three sets of
differential red, green and blue + one set of differential CLK, which is very
important. Any abnormality in any one of them will cause various image-related
failures such as white screen, gray screen, and blurry screen. Normally we
can get the LVDS waveform as follows:
6.
Application Of Oscilloscope To Repair Power-Off Faults:
In laptop maintenance, power-off faults are often a headache
for maintenance personnel. Here we teach students how to quickly find the fault
point using the dual-channel comparison method of an oscilloscope for such
faults.
Oscilloscope settings:
(1) Select Normal as the trigger mode;
(2) Select Falling Edge as the edge type;
(3) The trigger level is half of the voltage value of the
measured point.
Below we give an example of a diagram of a fault we usually
encounter during maintenance, to briefly explain:
Example 1:
First, the blue line of channel 1 in the picture below is
VCCDDR, and the yellow line of channel 2 is PLTRST#.

It can be clearly seen from the above
figure, because they dropped almost at the same time, but the difference is
that PLTRST# dropped suddenly, while VCCDDR dropped continuously, so it can be
judged that VCCDDR was forced to drop due to the sudden loss of PLTRST# , this
also found the cause of the power failure, which was caused by PLTRST#.
Example 2:
The blue line in the picture below
is SLP_S5#, and the yellow line is PLTRST#.

From the comparison of the two figures above, it is difficult to determine which is the cause and which is the effect, because they suddenly dropped almost at the same time, so in actual maintenance, if we encounter a similar situation, we need to re-take one of the signals and the other. The signals or voltages are compared until the cause and effect can be clearly seen, and then the power-down range can be locked.
Example Three:

6. The Following Is An Abnormal Waveform Captured By The Faulty Board During Actual Repair. It Is For Reference Only.
System 3V overvoltage protection.

BOOT bootstrap happiness is too high.

The CPU power supply NEC large capacitor filter is poor.

SPD without memory.

There is no BIOS waveform of the CPU after power on.

The independent graphics power supply GPU _CORE voltage drops.

- Double Click Computers


No comments:
Post a Comment